Before the census church records recorded the population. In 1125 there were said to be thirteen half-virgaters¹ occupying the Manor of Eye. By 1231 there was said to be 15 full virgaters (peasants) and 14 tofters (who ran the homesteads), a total of 29 tenants.² Average life expectancy around this time was around 30 years.
¹ A virgate was a unit of land area measurement used in medieval England and was held to be the amount of land that a team of two oxen could plough in a single annual season, about 30 acres. A ‘virgater’ would thus be a peasant who occupied or worked this area of land, and a ‘half virgater’ would be a person who occupied or worked about 15 acres (6 Hectares).
² The Other Economy Pastoral, Husbandry on a Medieval Estate, Kathleen Biddick
In 1801 the first national census gathered information about the population of England and Wales. Taken every ten years the census gathers data on topics that include age, health, education, ethnicity, language use, work and religion, amongst others. National and local government organisations use this information in a variety of ways, such as allocating funding, planning services, and otherwise understanding local populations. The 2011 Census took place on 27 March 2011.
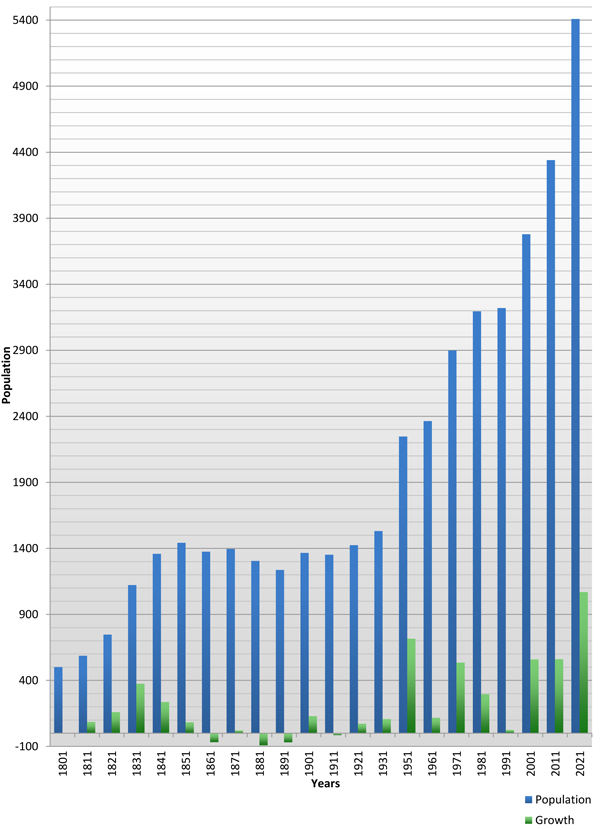
In 1801 there were 501 people living in Eye, by 1851 this figure had leapt to 1,442. Over the next 40 years, the population then decreased, falling to its lowest point of 1,237 by 1891. This was happening all over the country in the mid to late 19th century as people left rural communities and moved into cities. The railway arriving in the village in 1966 meant easy access to Peterborough and the rest of the country. This was the last period of time the population decreased in the parish.
In 2011 the population in the parish of Eye was 4,340 by 2021 that had grown to 5,409, an increase of 1,069 the largest growth in numbers for a 10-year span in the villages recorded history.
In 2011 were 1,799 households and on average 2 – 3 people live in each house. 866 (20%) are 15 or under and 723 (16.7%) are 65 or over. 816 (43.3%) live in detached houses or bungalows and 71.8% of the houses in the village are owner-occupied. Nearly 400 of you do over one-hour unpaid care a week. Only 80 (3.7% ) travel to work by bus but 1,607 (73.4%) travel by car or van. You can see a summary of the 2011 Census here.
The last census was in 2021.
Population of Eye 1801 to 2021
[table id=5 /]
* 1941 – No Census was taken during wartime
** 1951 – 20 years of data due to no census in 1941 (averages out at a population growth of 358 for each decade)
*** Part of Eye parish (approximately 190 persons, 32 hectares) was transferred to East Ward following boundary changes in the Peterborough (Parishes) Order 2004.
Between census years Peterborough City Council produces population estimates, the population estimates. Further information here: https://www.peterborough.gov.uk/council/about-peterborough/population/
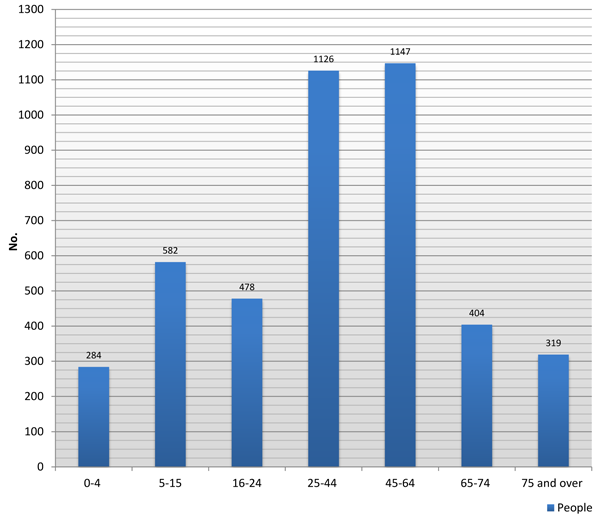
The age spread within Eye’s population from the 2011 Census.
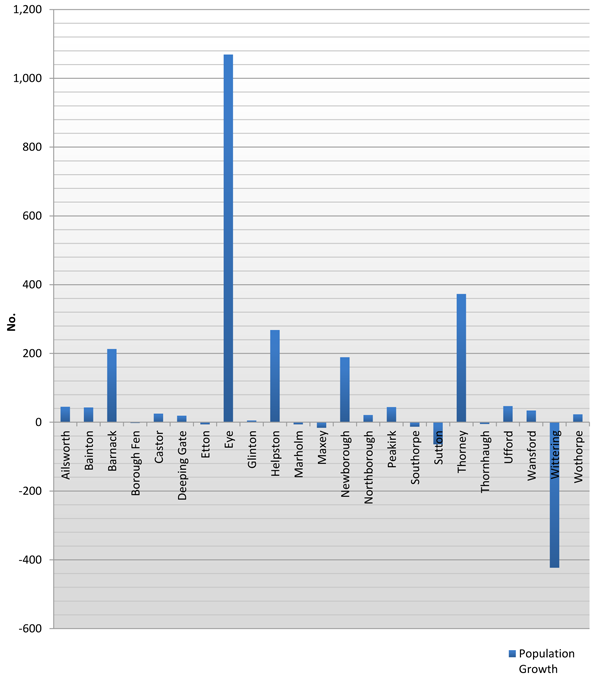
Population changes between 2011 and 2021 including other villages in the Peterborough area.